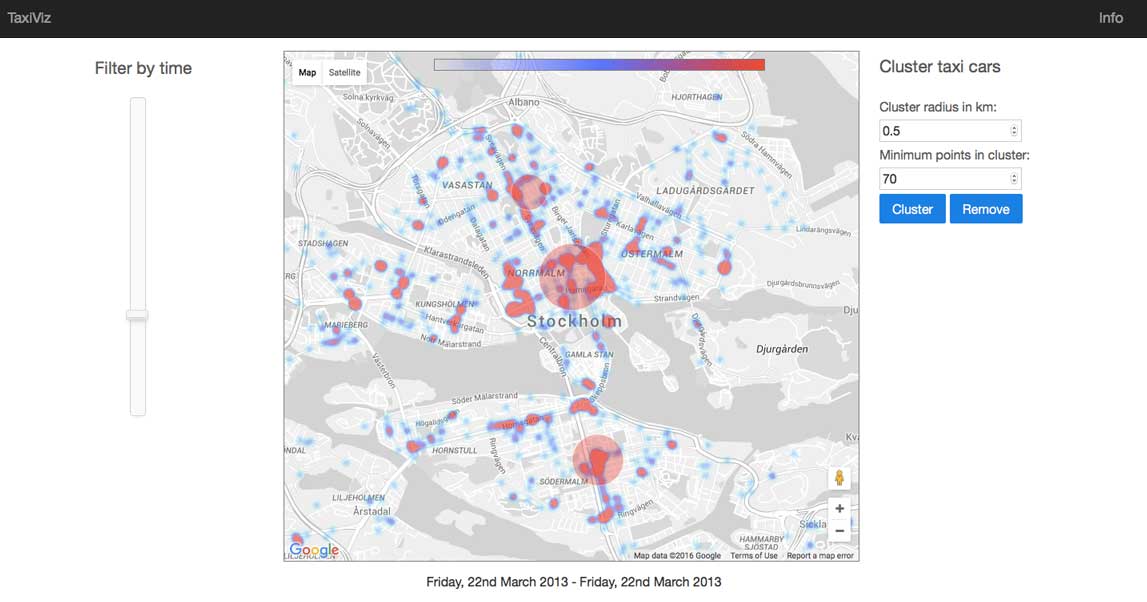
This project was the examinating task in a course in Information Visualization, TNM048. We were given a dataset of around 800MB or 13 million unique datapoints with information about location, time and status of roughly 1500 taxi cars driving around Stockholm during March 2013. The tool visualizes where in Stockholm it is most popular to hire a cab during different time periods. It also includes the data mining algorithm OPTICS to cluster the spatial data on the map.
Read the report, it’s fairly short! The source is available on github.